data visualizations
If only birds were ‘puppies’: Lights Out Baltimore tracks 3,000 window collisions since 2018
In this feature article, I explore Baltimore’s bird collision crisis through data analysis, narrative and photojournalism, spotlighting the work of dedicated volunteers.
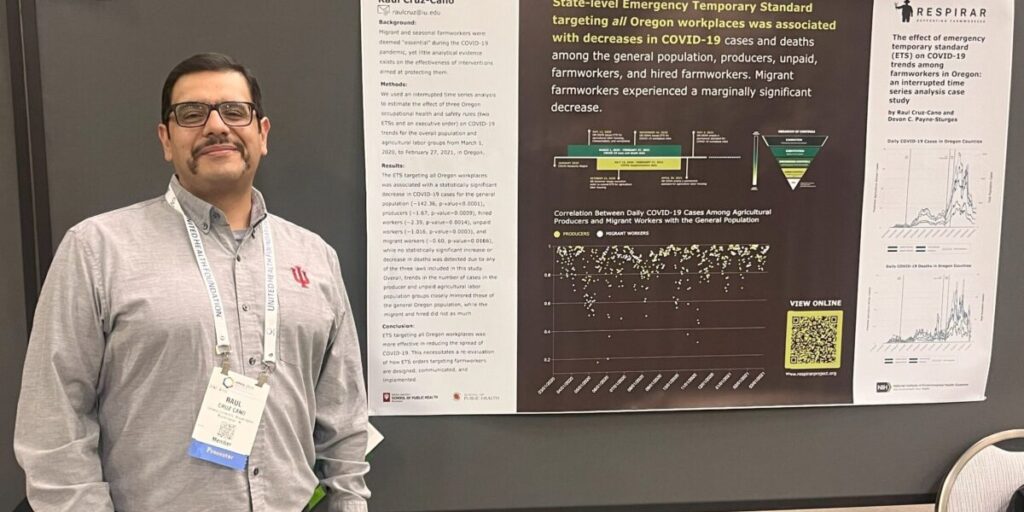
Read MorePoster design and data visualizations at the 2024 American Public Health Association’s annual meeting
This was my first time designing a scientific poster. View before & after data visualizations and graphics.
Read MoreBehind the scenes: analyzing indoor air quality data in farmworker housing during Canada’s 2023 wildfire
Using R Studio and Datawrapper, I analyzed RESPIRAR air quality data to uncover indoor air quality spikes during wildfire events.
Read MoreData visualizations for news story covering Maryland police trends
I led a data analysis for ‘From local police to private guards,’ an investigative series published in the Baltimore Banner. My work included analyzing FBI crime data to reveal a nearly 10% drop in Maryland law enforcement personnel from 2019 to 2023 and designing an interactive map showing personnel trends by county.
Read More


