Behind the scenes: analyzing indoor air quality data in farmworker housing during Canada’s 2023 wildfire
*Data and analysis are based on preliminary research and should not be used for publication.
Over the summer, I analyzed raw data from two indoor air quality monitors active in May and June 2023. This level of analysis would have felt daunting before taking a data journalism class just a few months earlier. Equipped with the coding software R and the data visualization tool Datawrapper, I was ready to dive in.
I nearly leaped for joy when I found a function converting particulate matter data into air quality index (AQI) values. This proved to be a game changer in how I approached the analysis and shaped the information we later shared.
Tools used
- R Studio: data analysis
- Datawrapper: Data visualizations
- Squarespace: custom blog layout with inline HTML and CSS codes
- Canva: Infographic, "Improve your indoor air quality"
Project Context
This analysis was completed as part of my work with the RESPIRAR Project. When permitted, Awair Omni air monitors measure carbon dioxide, humidity levels, PM 2.5, temperature, and total volatile organic compounds to determine air quality levels. The purpose was to access indoor risks to repiratory viruses, including COVID-19 and the flu.
Then, Canada’s 2023 wildfires swept through the region, prompting Dr. Devon Payne-Sturges, RESPIRAR's lead investigator, to consider whether the air monitors might detect new patterns during the wildfire event.
We knew from anecdotal accounts that farmworkers continued working outdoors during the event. This raised the question: Did they experience any reprieve from the smog once indoors after working all day without protection?
Key Findings
My analysis revealed how outdoor air can significantly impact indoor air quality. This is especially important because indoor air pollutants are not federally regulated under the Clean Air Act. Additionally, many states, including Maryland, lack regulations for indoor air quality aside from smoking prohibitions.
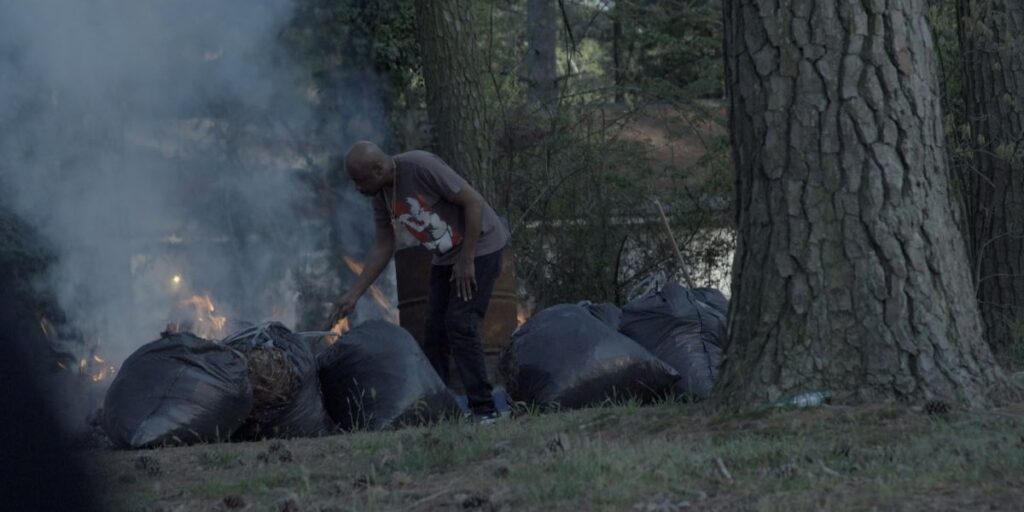
The data also showed spikes in air pollution outside the wildfire episodes, which could be linked to outdoor burning practices along the Eastern Shore. Trash collection services are not always available in remote regions, and the RESPIRAR team has observed outdoor burning when transportation is limited or unavailable.
Unfortunately, outdoor burning contributes to poor indoor air quality. This was something I personally experienced and witnessed during farmworker housing visits.
Feedback
I produced data visualizations using the results from my R Studio analysis. These were formatted in APA style for an academic audience, including the project’s funder, the National Institutes of Health. I blended RESPIRAR branding with established AQI color codes to ensure consistency and clarity.
In addition, I created an info-graphic/flyer titled Improve Your Indoor Air Quality to share practical strategies with farmworkers. The flyer was distributed in English, Spanish, and Haitian Creole.
I wished I could have also pivoted the blog into a news story to reach a broader audience. Unfortunately, this would have presented a conflict of interest.
As a communicator, though, my goal is to make information as digestible and accessible as possible so others can reuse and disseminate it for their purposes.
Data Visualizations
I produced these data visualizations after running my analysis in R Studio. The graphics and copy were formatted for APA style and with an academic audience in mind, along with the project's funder, the National Institute of Health. I attempted to blend the RESPIRAR branding with the established air quality index color codes.
I also produced an infographic/flyer distributed to farmworkers to communicate different means to regulate indoor air quality. The flyer was produced in English, Spanish, and Haitian Creole.


